Major Reports |
Report Summary | Trade Summary | Portfolio Evaluation Report | Transaction Report | Graph Document | Performance Report |
|
|
 Click to enlarge image Click to enlarge image |
Glossary Definition This customizable report displays attributes for each instrument an attribute may be defined (a trivial example is "Ticker Symbol") or calculated (for example "Trading Valuation", the number that defines, as well as is possible with a single number, the attractiveness of the given issue at its quoted price). Features included in this report include:
- Selection of columns: With nearly 300 reportable attributes, reports may be customized and changed at will
- Sorting: Any column may be sorted, in either ascending or descending order
- Links to Glossary: All column headings have a link to the glossary, for an explanation of the meaning and calculation of the reported data
- Drill Down: Most calculated values will, when right-clicked, display a context menu which will provide further details of the value's calculation.
|
|
 Click to enlarge image Click to enlarge image |
Glossary Definition This customizable report displays scores representing HIMIPref™'s recommendations on trades or, if desired, comparative information regarding the universe of trades analyzed. Features included in this report include:
- Five views of the data : Choose between
- Sorted Summary of feasible trades: There is a lot of information in this report! The "Best Trades Report Box" (Image | Glossary Definition) helps sort it out.
- Sorting of Report Rows : Rank the purchaseable preferred shares in various orders
- Drill Down : Report boxes provide details about the source of the reported numbers (see tradeReportContextMenu).
|
|
 Click to enlarge image Click to enlarge image |
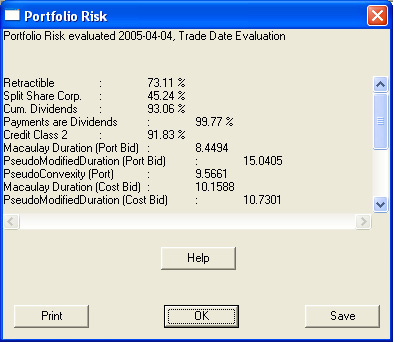
Glossary Definition This customizable report displays an evaluation of the portfolio, using data stored by the user in his transactions or holdings database table. Some of the features of this report are: - Select fields - any instrument attribute may be included in the report.
- Sum or report a weighted average for any or all columns
- Set the number of decimal places to be reported in each column
- View the measurements of portfolio risk in the "portfolioRiskReportBox" (Image/Glossary Definition)
|
|
 Click to enlarge image Click to enlarge image |
Glossary Definition This report shows all the data contained within the user's transaction data base. Any single user-defined account may be selected and displayed, with the following features: - Define Fields: Any selection from among 17 reportable fields may be displayed, including:
- Sort by security
- Restrict displayed transactions by date
|
|
 Click to enlarge image Click to enlarge image |
Glossary Definition This exceptionally powerful reporting tool allows the graphing of virtually all data produced by HIMIPref™. The main categories of available graphs are: - Instrument Price Variance: examine the changing attributes of an instrument over a range of prices
- Historical Yield Curve: examine the change in yield-curve attributes over time
- Historical Instrument: examine the change in an instrument's attributes over time
- Yield Curve: Display the yield curve for a specified date
- Attributes : show a scatter-plot of any two attributes for all instruments on a given day
The major display features available allow the user to show or suppress: - Grid Lines
- Zero Origin
- Plot with
- Lines and Boxes
- Lines Only
- Boxes only
- Vary the pen-width, for either the grid or the plot
- Comparators
- Regressions
- Segregation of data by credit class
|
|
 Click to enlarge image Click to enlarge image |
Glossary Definition This reporting tool allows for the display of performance of issues or portfolios analyzed by HIMIPref™. Data may be displayed with reporting intervals by: - Raw Data (including cash flows)
- Month
- Quarter
- Year
- Annualized.
Turnover may be reported for portfolios instead of performance and in all reports a comparator may be selected.
|

