//

Yields

Yield Curve Calculation


As noted in the overview of HIMIPref™

The preferred share market is weakly efficient.

  • It is assumed that a fair value for each instrument exists and is calculable by reference to similar instruments.
  • It is presumed that divergences from this fair value will occur, but the market price for each instrument will not be too far from this fair value and will sometimes be higher, sometimes lower.

The most basic methodology for determination of fair value in a fixed income system is construction of a yield curve - a function relating the yield of an instrument with its expected term to maturity. This methodology does indeed form an important part of the HIMIPref™ analytical methodology through several stages.

The Core Yield Curve

This represents the relationship between yield and term in the absence of any risk factors - but there are two very important notes that must be borne in mind when considering the concept:

  • The "term" referred to in the above statement refers to the term to each individual cash-flow — an instrument expected to be in existence for the next 30 years and paying quarterly dividends in a taxable environment will have at least 120 dividend payments, 1 maturity payment and 31 tax payments which must each be discounted at a unique rate based on term.
  • Risk factors may increase or decrease the term-based yield used to discount the future payments.

As stated in the Glossary

The yield applicable to instrument i with a cash flows payable at time t with tax-rate x is:

That is to say, HIMIPref™ will calculate a different yield curve for different tax rates and the curve is presumed to be flat (the base rate) with a short term shape adjustment (yieldCurveShortTerm, yieldCurveDecayShort) and a long-term shape adjustment (yieldCurveLongTerm, yieldCurveDecayLong). The core rate may be graphed or reported in the yieldCurveReportBox or historicalYieldReportBox. Individual components of the core rate may also be graphed over time.

Risk Adjustments to the Yield Curve

The following table shows the risk factors implicit in a particular preferred share that may influence the "fair" yield in a manner that is consistent across issues:

Risk Factors Influencing "Fair" Yield

Risk Factor

If present, the "fair" yield on the instrument will be adjusted ...

Sample Image

Pays Interest (not dividends)

Indeterminate

Graph

Dividends are cumulative

Lower

Graph

Issuer is a Split Share Corporation

Indeterminate

Graph

Issue is retractible

Lower

Graph

Issue is "Credit Class 2"

Higher than "Class1"
Lower than "Class3"

Graph

Issue is "Credit Class High"

Lower

Graph

Issue is "CreditClassLow"

Higher

Graph

Issue trades with more volume than peers

Lower

Graph

Issue pays Floating Rate Dividends

Indeterminate

Graph

Issue is "Credit Class 3

Higher than both "Class 1" and "Class2"

Graph

Yield Curve Computation

Instruments are included in the calculation of the yield curve if:

  • their computed value of pseudoModifiedDurationCost is calculable and exceeds a minimum, and
  • they actually exist — that is, that they are not pre-issue instruments incorporated into the system at issue price, and
  • they have a credit rating equal to or in excess of a minimum (Credit Class 3 - Low)
.

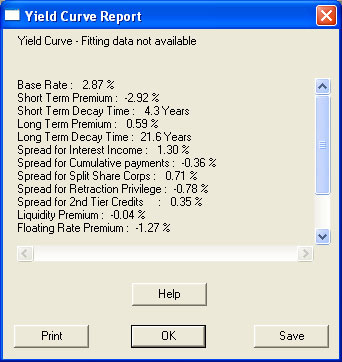
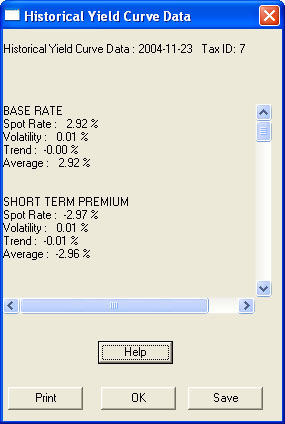
All risk factors will normally be computed in the course of the analysis, but each may be skipped if there is insufficient heterogeniety of that risk factor to allow a meaningful analysis. The elements of the "core curve" will generally be constrained to be within a small tolerance range of the previous day's calculation, if such a calculation exists.

Successive attempts are made to find a best fit of the curve to the data; the curves are applied to the cash-flows developed in the computation of "Curve Yield" to determine a "curve mean price" (the average of the prices found by applying the curve to the "bid" and "ask" cash flows). If the Curve Mean Price is between the actual bid and offer price of the instrument, the variance is zero for that instrument; otherwise, the variance is considered to be the square of the difference between the Curve Mean Price and the closest price of the quotation pair.

Perturbations are applied iteratively to the candidate Yield Curve and continued until all relevent risk factors and core factors cannot be varied to improve the fit. Due to the deliberate tolerance for error implicit in accepting any derived price between the bid and the ask as giving rise to a variance of zero, solutions are not precisely unique; tests have found, however, that the final curve represents a global minimum variance.